How can universities and colleges increase enrolment, or better tailor their services for international students? These were just some of the questions addressed at the first Ontario Public Sector Tableau User Group.
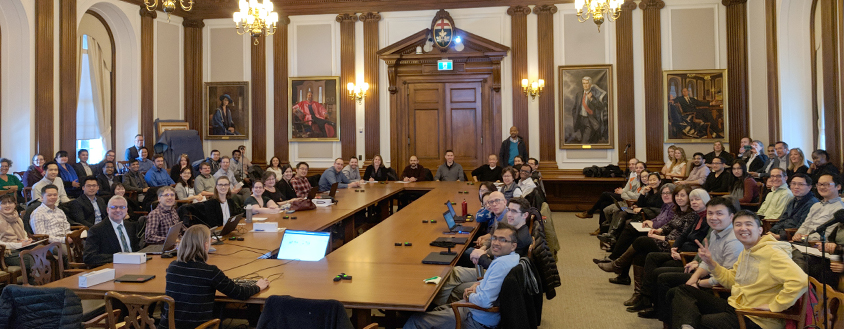
On March 19, U of T’s Enterprise Applications and Solutions Integration (EASI) welcomed over 120 attendees from Ontario’s public sector to learn how to make effective decisions by using Tableau – a powerful analytics data platform.
“U of T is becoming a leader in business intelligence – which is the process of analyzing and visualizing data to make fact-based decisions,” says Robert Jordan, Business Intelligence Manager at EASI. “We saw an opportunity to bring together data experts in the public sector to share knowledge and best practices.”
Attendees at the Ontario Public Sector Tableau User Group included employees from various levels of government, and colleges and universities from as far away as Lakehead.
“It was a great opportunity to talk to a few people who are going through the same situation that we have here at Queen’s, and I look forward to our next get together very much,” says Simon Labbett, Manager Application and Infrastructure at Queen’s University.
Presenters included Tamara Augsten, a Policy Development Officer with Children’s Services at the City of Toronto. Augsten showed the group how she uses Tableau to measure the well-being of Toronto’s children and families.
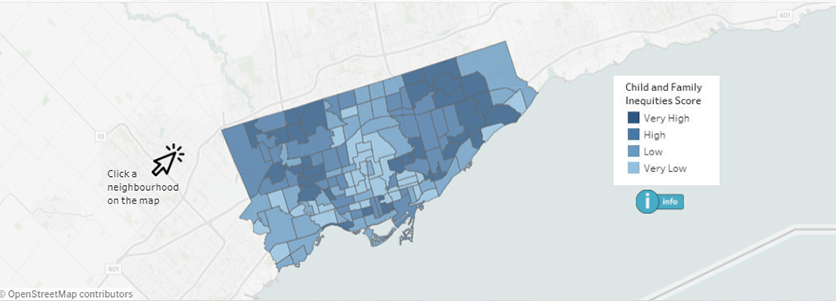
An interactive map showing child and family inequities in Toronto (image courtesy of Raising the Village)
Joseph McNamara, a Resource Planning and Analysis Officer for the University of Toronto Scarborough, followed. He provided examples of how geographic data visualization can highlight the special needs of the student population, assist with student recruitment and how school space is used.
And Ric Mucciacciaro, from the Ministry of the Environment and Climate Change, showed how to analyze and visualize any amount of data – from 30 to millions.
What’s next for Business Intelligence at U of T?
The team can help any U of T unit connect to the Tableau Server and will provide free, in-class training. They are also developing the Institutional Data Hub, a Business Intelligence website with news, instructions, user guides and data initiatives, as well as public-facing reports and data governance procedures.
And the user group will continue to meet every two months.
“These meetings are open to anyone in the public sector who wants to share case studies and learn from others,” says Jordan. “We want to empower data users to understand their business requirements, set goals and measure success – we’re at the frontier of unlocking insights that will reinvent the student experience.”
For more information and to attend future meetings, contact data@utoronto.ca